
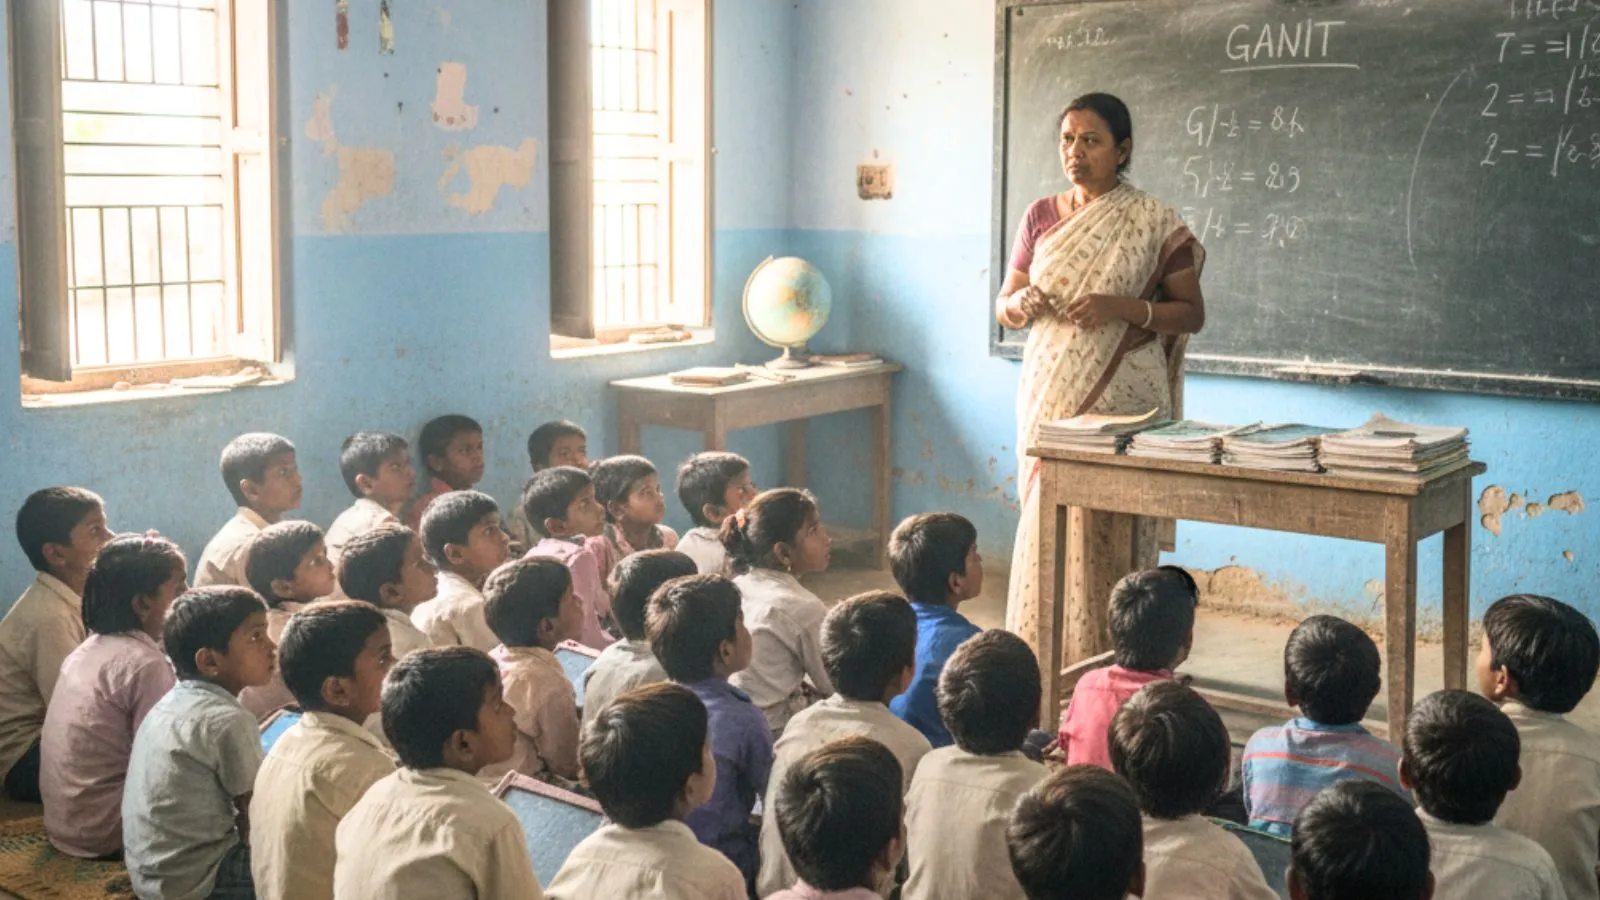
India’s single-teacher schools dropped in number. The count fell from 1,04,125 in 2024-25 to 1,00,843 in 2025-26. That’s a net decline of 3,282 schools in a single year.
The numbers come from UDISE, the government’s official school education database. They were also tabled in the Rajya Sabha in late July, in response to a question on teacher vacancies.
What is a single-teacher school? Simple. One teacher handles every class and every subject alone. Experts widely use this as a marker of under-resourced schooling.
One National Number, Two Very Different Stories
The national figure looks straightforward. It isn’t. Five states alone cut more than 11,000 single-teacher schools between them. That’s over three times the size of the entire national decline.
At the same time, other states moved the opposite way. They added thousands of single-teacher schools to their count. The national drop of 3,282 is just the net result of these two opposing forces cancelling each other out.
Where the Numbers Fell
Madhya Pradesh cut the most. Its count fell from 7,217 to 2,269. That’s a reduction of 4,948 schools, bigger than the entire national net decline on its own.
Chhattisgarh came next. It dropped from 5,973 to 2,461, a fall of 3,512 schools.
Uttar Pradesh still has the highest number of single-teacher schools among major states. But it made progress too, cutting its count from 9,508 to 7,874, down by 1,634.
Punjab and Gujarat rounded out the top five. Punjab fell by 682 schools. Gujarat fell by 601.
| State | 2024-25 | 2025-26 | Change |
|---|---|---|---|
| Madhya Pradesh | 7,217 | 2,269 | -4,948 |
| Chhattisgarh | 5,973 | 2,461 | -3,512 |
| Uttar Pradesh | 9,508 | 7,874 | -1,634 |
| Punjab | 2,431 | 1,749 | -682 |
| Gujarat | 2,936 | 2,335 | -601 |
Where the Numbers Rose
Andhra Pradesh saw the biggest jump in the country. Its count rose from 12,912 to 16,357, an increase of 3,445 schools. This is notable because Andhra Pradesh already had one of the highest counts among states even before this rise.
Maharashtra and Rajasthan also added more than a thousand each. Maharashtra rose by 1,117. Rajasthan rose by 1,083.
Karnataka and Jharkhand saw smaller increases. Karnataka added 693 schools. Jharkhand added 655.
| State | 2024-25 | 2025-26 | Change |
|---|---|---|---|
| Andhra Pradesh | 12,912 | 16,357 | +3,445 |
| Maharashtra | 8,152 | 9,269 | +1,117 |
| Rajasthan | 6,117 | 7,200 | +1,083 |
| Karnataka | 7,349 | 8,042 | +693 |
| Jharkhand | 9,172 | 9,827 | +655 |
What the Government Said, and Didn’t Say
The Centre’s Rajya Sabha reply doesn’t explain why states moved in such different directions. It points to general factors instead. Retirement. Resignation. Creation of new posts. Rationalisation of teacher deployment. Changes in enrolment. None of these get linked to any specific state.
The reply also left part of the original question unanswered. Lawmakers had asked for the sanctioned strength, working strength, and vacancies of teachers, broken down by state. The government’s response: that data sits with state governments and Union Territory administrations.
It wasn’t tabled. What the government did share instead was the number of teachers currently in position, plus the single-teacher school count, both sourced from UDISE+ 2025-26.
The Catch Behind the Good News
A falling number sounds like good news. But there’s a real gap in the data. Sanctioned posts and vacancies were never shared. Without that, there’s no way to tell how many of these reductions came from new teacher appointments, and how many came from schools simply merging, closing, or getting reclassified.
Pupil-Teacher Ratio: An Improvement, But Not an Exact Comparison
The two years measured pupil-teacher ratio (PTR) differently, which makes a direct comparison tricky.
UDISE+ 2024-25 gave one single national number: 24 students per teacher. UDISE+ 2025-26 didn’t give one overall figure. Instead, the government’s reply broke it down by schooling level: 19 at primary, 17 at upper primary, 15 at secondary, and 23 at higher secondary.
Every one of these 2025-26 figures sits below the 2024-25 composite number of 24. The government’s reply notes all four fall within National Education Policy 2020 norms, which call for a PTR below 30 nationally, and below 25 in areas with a high share of socio-economically disadvantaged students.
Since the two years use different measurement methods, this points toward improvement in direction, not a clean like-for-like comparison.

Curated news reports, in-depth analysis, and special features by India’s Opinion editorial team.