
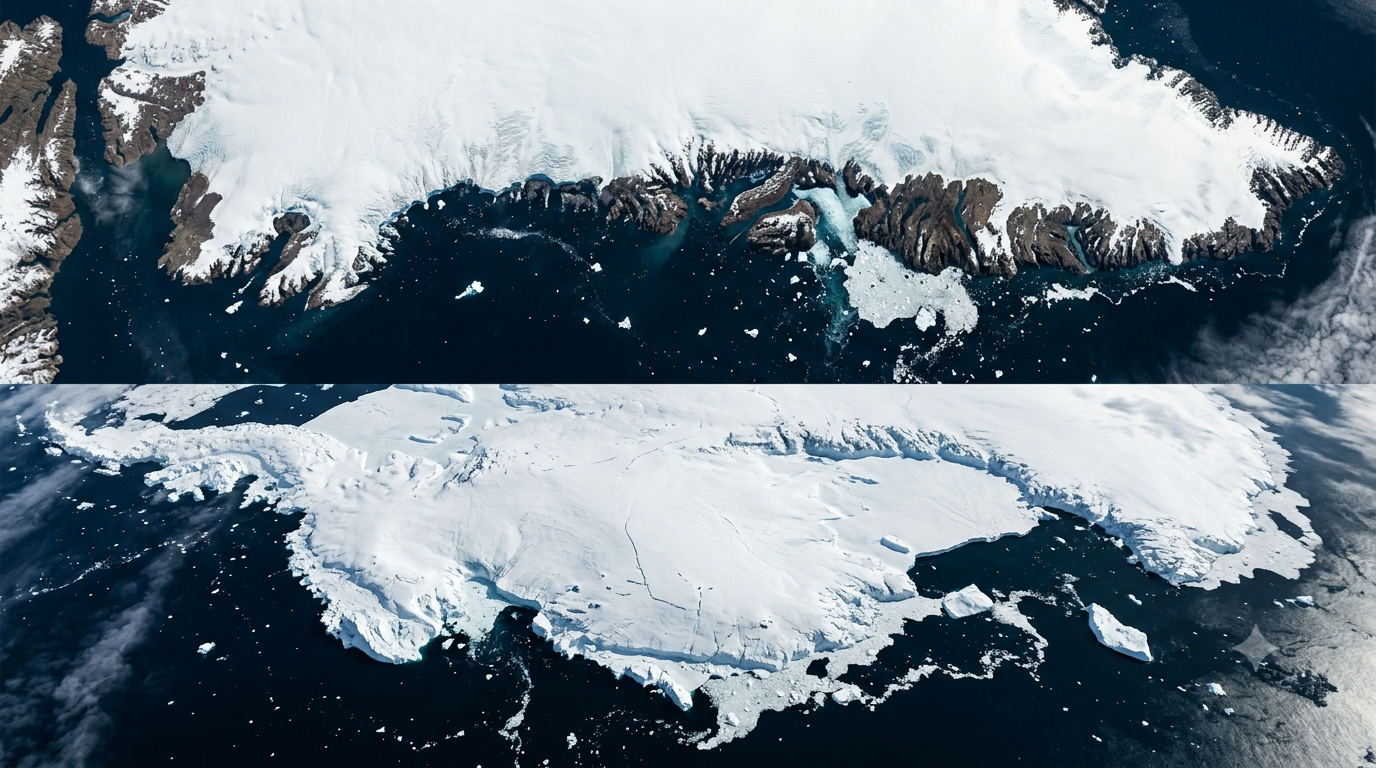
A new analysis of decades of satellite observations has found that Greenland and Antarctica together lost about 11.3 trillion tonnes of ice between 1979 and 2023. This contributed around 3.14 centimetres to global sea-level rise.
The study brings together measurements from 27 satellite missions and 42 independent surveys. Researchers say it provides one of the most detailed long-term records yet. It tracks changes in the world’s two largest ice sheets.
The research was conducted by the Ice Sheet Mass Balance Inter-comparison Exercise, or IMBIE, an international collaboration involving polar scientists. The findings were published on September 16 in Scientific Data.
Greenland and Antarctica Are Losing Ice in Different Ways
The study found that the two ice sheets lost ice at different rates and through different processes. Between 1979 and 2023, Antarctica lost about 4,780 billion tonnes of ice. Meanwhile, Greenland lost roughly 6,215 billion tonnes between 1972 and 2023.
Greenland’s losses accelerated sharply after the 1990s. Its average annual ice loss reached about 264 billion tonnes during the 2010s. This compared with about 60 billion tonnes a year in the 1980s.
Antarctica’s ice loss has been dominated by changes in West Antarctica. The researchers found that West Antarctica’s ice discharge increased substantially over the decades covered by the study.
Most Ice Loss Came From Faster-Moving Glaciers
One of the study’s important findings is that the change cannot be explained simply by surface melting.
Researchers estimate that 84% of the combined ice loss came from ice dynamics. Mainly, glaciers flowing faster carried ice into the ocean.
The remaining 16% came from changes in surface mass balance, including snowfall and surface melting.
That distinction matters because it shows how the interaction between oceans and ice sheets can influence sea-level rise.
As glaciers accelerate toward the coast, they transfer more ice directly into the ocean.
Scientists say a warming ocean plays an important role in this process, particularly around parts of Antarctica.
Ice Loss Accelerated After the 1990s
The long satellite record also shows a major change in the pace of ice loss. Greenland was close to a state of balance in the 1970s. This means gains from snowfall were roughly offset by losses.
Its losses then increased through subsequent decades. During the 2010s, Greenland lost ice at an average rate of about 264 billion tonnes per year, according to the study.
Antarctica also experienced substantial losses, particularly in West Antarctica.
However, increased snowfall in East Antarctica during 2022 and 2023 temporarily offset some of the losses elsewhere.
The researchers therefore caution against interpreting the lower Antarctic loss rate during 2020–2023 as a reversal of the longer-term trend.
Recent Antarctic Changes Show Why Long-Term Data Matters
The study found that East Antarctica gained mass during the final four years of the research period. This was because of unusually high snowfall.
That gain helped reduce Antarctica’s overall rate of ice loss between 2020 and 2023.
However, West Antarctica continued to lose ice. The researchers also found substantial differences between some satellite measurement methods when assessing East Antarctica. This highlights the uncertainty involved in measuring changes across such a vast and remote region.
This is why scientists combine observations from different satellite systems rather than relying on a single measurement technique.
What Does the Ice Loss Mean for Sea Levels?
The combined ice loss from Greenland and Antarctica contributed about 31.4 millimetres of global mean sea-level rise between 1979 and 2023.
That may appear small when expressed as a global average. However, sea-level rise can have significant consequences for low-lying coastal regions.
The two ice sheets are now responsible for roughly a quarter of global sea-level rise, according to the European Space Agency.
The effect also does not occur evenly around the world. Local sea-level changes depend on several factors, including ocean circulation, gravity and land movement.
Why Satellites Are Essential
Monitoring Greenland and Antarctica from the ground is extremely difficult because of their size and harsh conditions.
The new assessment combines data from 27 satellite missions, including measurements of ice elevation, gravity and glacier movement.
Researchers then compared 42 independent estimates to produce a consistent long-term record.
The record extends back to 1972 for Greenland and 1979 for Antarctica. This allows scientists to examine changes over roughly half a century.
ESA said the dataset helps researchers separate genuine changes in ice mass from differences. These differences are caused by the way individual satellite systems measure the ice sheets.
A Long-Term Warning From the Polar Ice Sheets
The study does not mean that every year will produce greater ice loss than the previous one.
Weather and snowfall can cause significant year-to-year changes, as seen in Antarctica between 2020 and 2023.
But the longer record shows a clear change in the overall balance of the ice sheets.
The researchers’ central finding is that faster-flowing glaciers have played a much larger role in the long-term loss than surface melting alone.
With Greenland and Antarctica together holding enough ice to influence global sea levels for centuries, continued satellite monitoring will remain important. It matters for understanding how the polar regions are changing and what those changes could mean for coastal areas worldwide.

Curated news reports, in-depth analysis, and special features by India’s Opinion editorial team.